React.js Real Time Earthquake App - 2

Expanding on the application and adding more features.
Getting Started 🧶
Last week we begun work on the Real Time Earthquake App. This week, I am going to be adding the functionality to color code the map points by seismic intensity along with some basic housekeeping and cleanup of the look and feel of the app itself.
You can read the tutorial here:

Setup and Environment 🧩
Like last time we are set up using Pigeon maps and an environment set up on Glitch.com (one of my favorite development applications).
Walkthrough 🥽
First things first, a new look. I created a quick new logo in Canva and edited a few lines of code in nav.jsx to give a bit of a more technical look to our app.
EarthquakeLayer.jsx
I updated the app at the EarthquakeLayer.jsx including the following function. It's quite simple really. It pulls the input called mag (magnitude of the earthquake already pulled and created as a variable) and then performs a simple loop to determine what bucket of color it lands in.
function MagColor(mag) {
if (mag >= 5) {
return "red" // strong earthquakes
} else if (mag >= 3) {
return "orange" // moderate earthquakes
} else {
return "yellow" // mild earthquakes
}
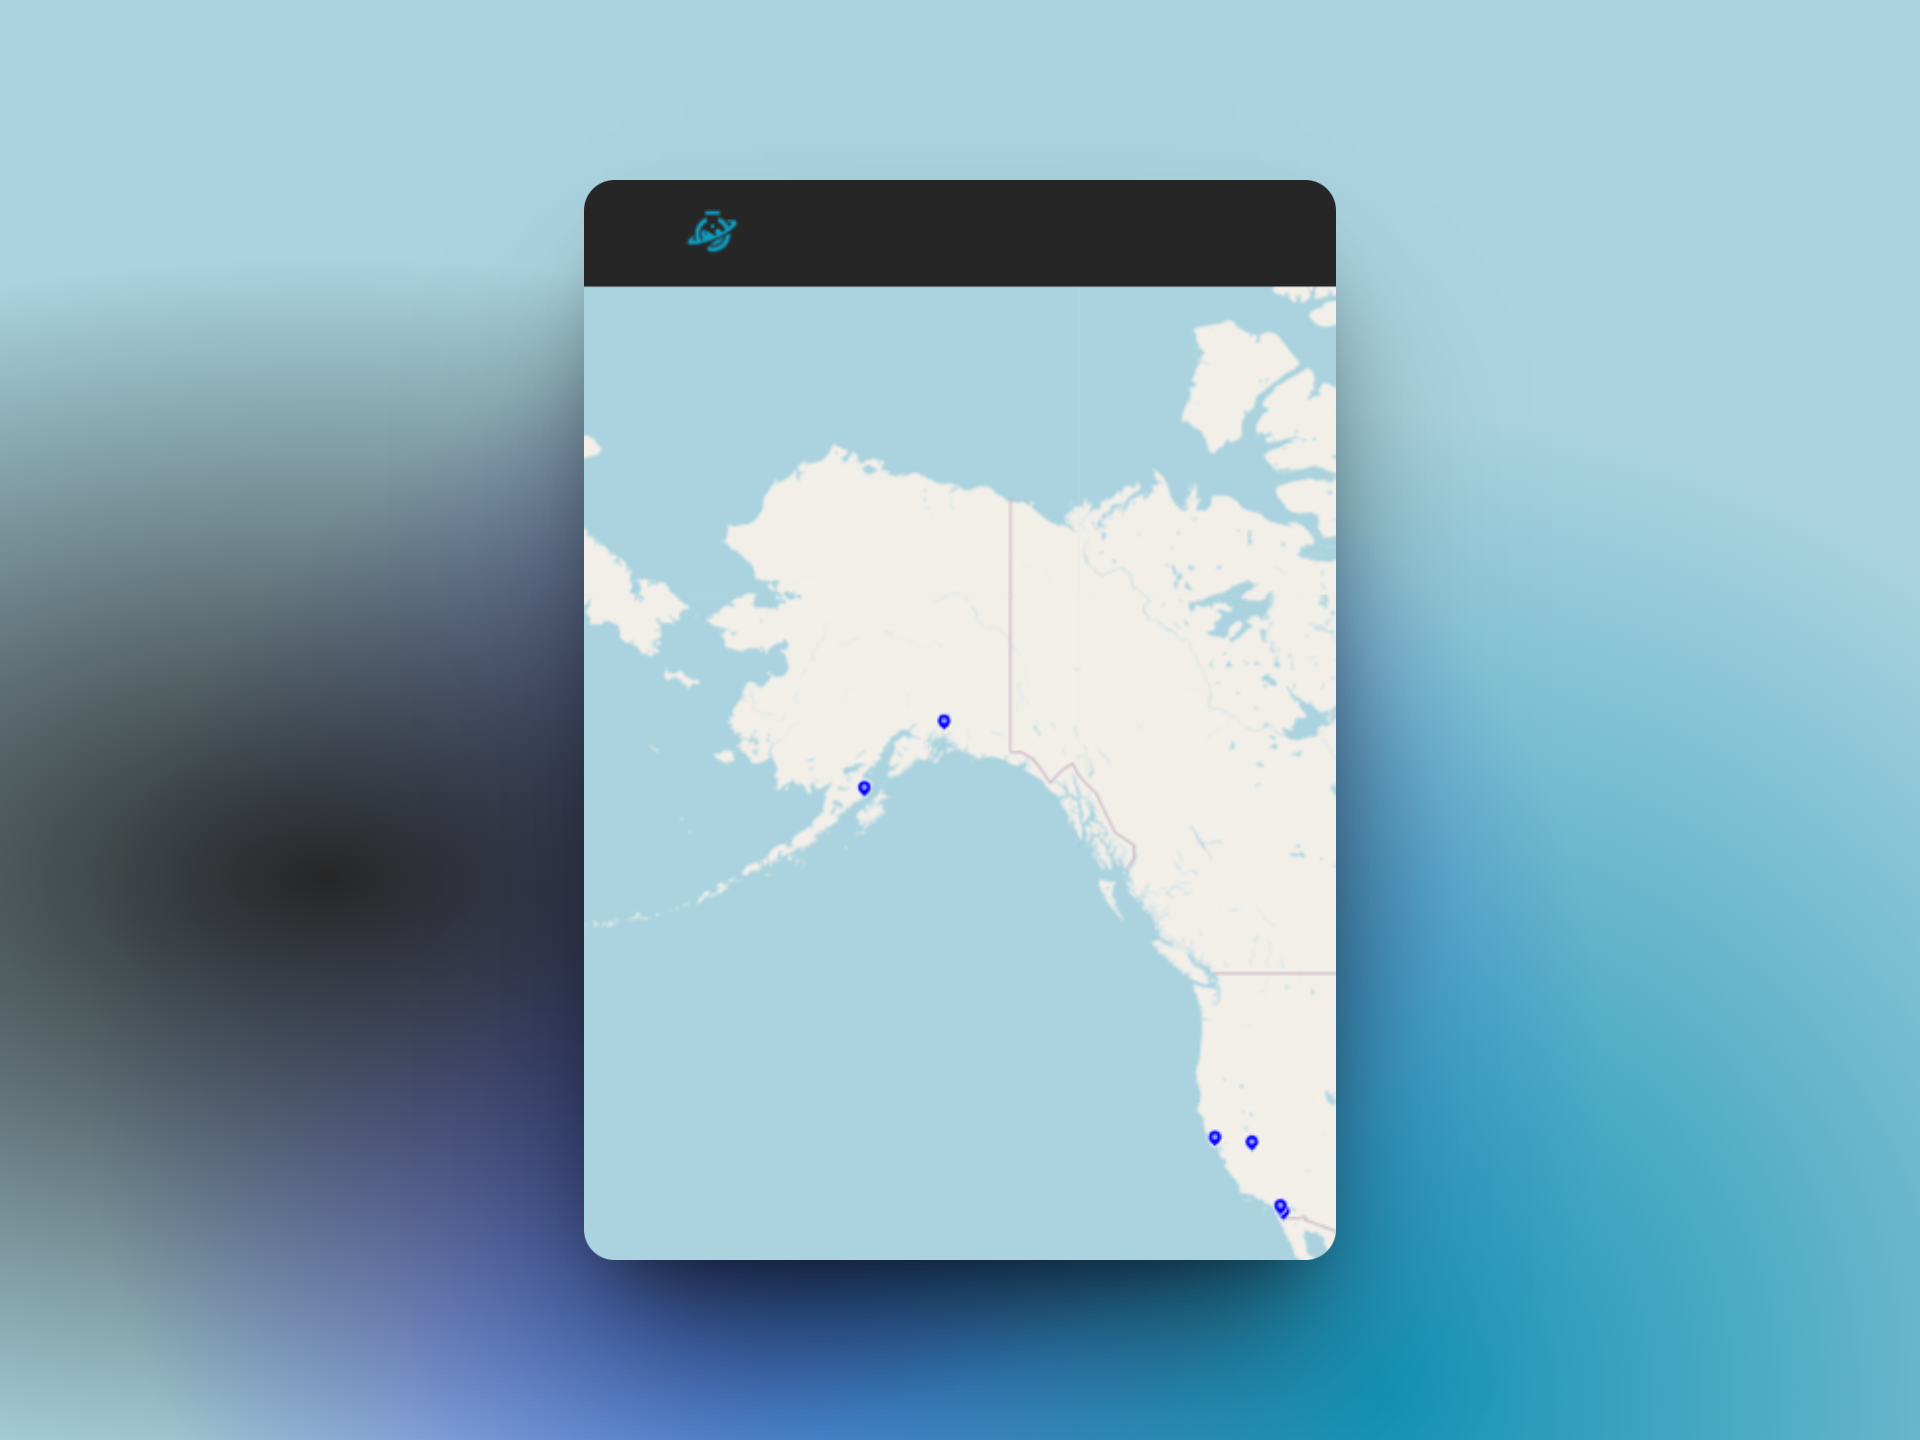
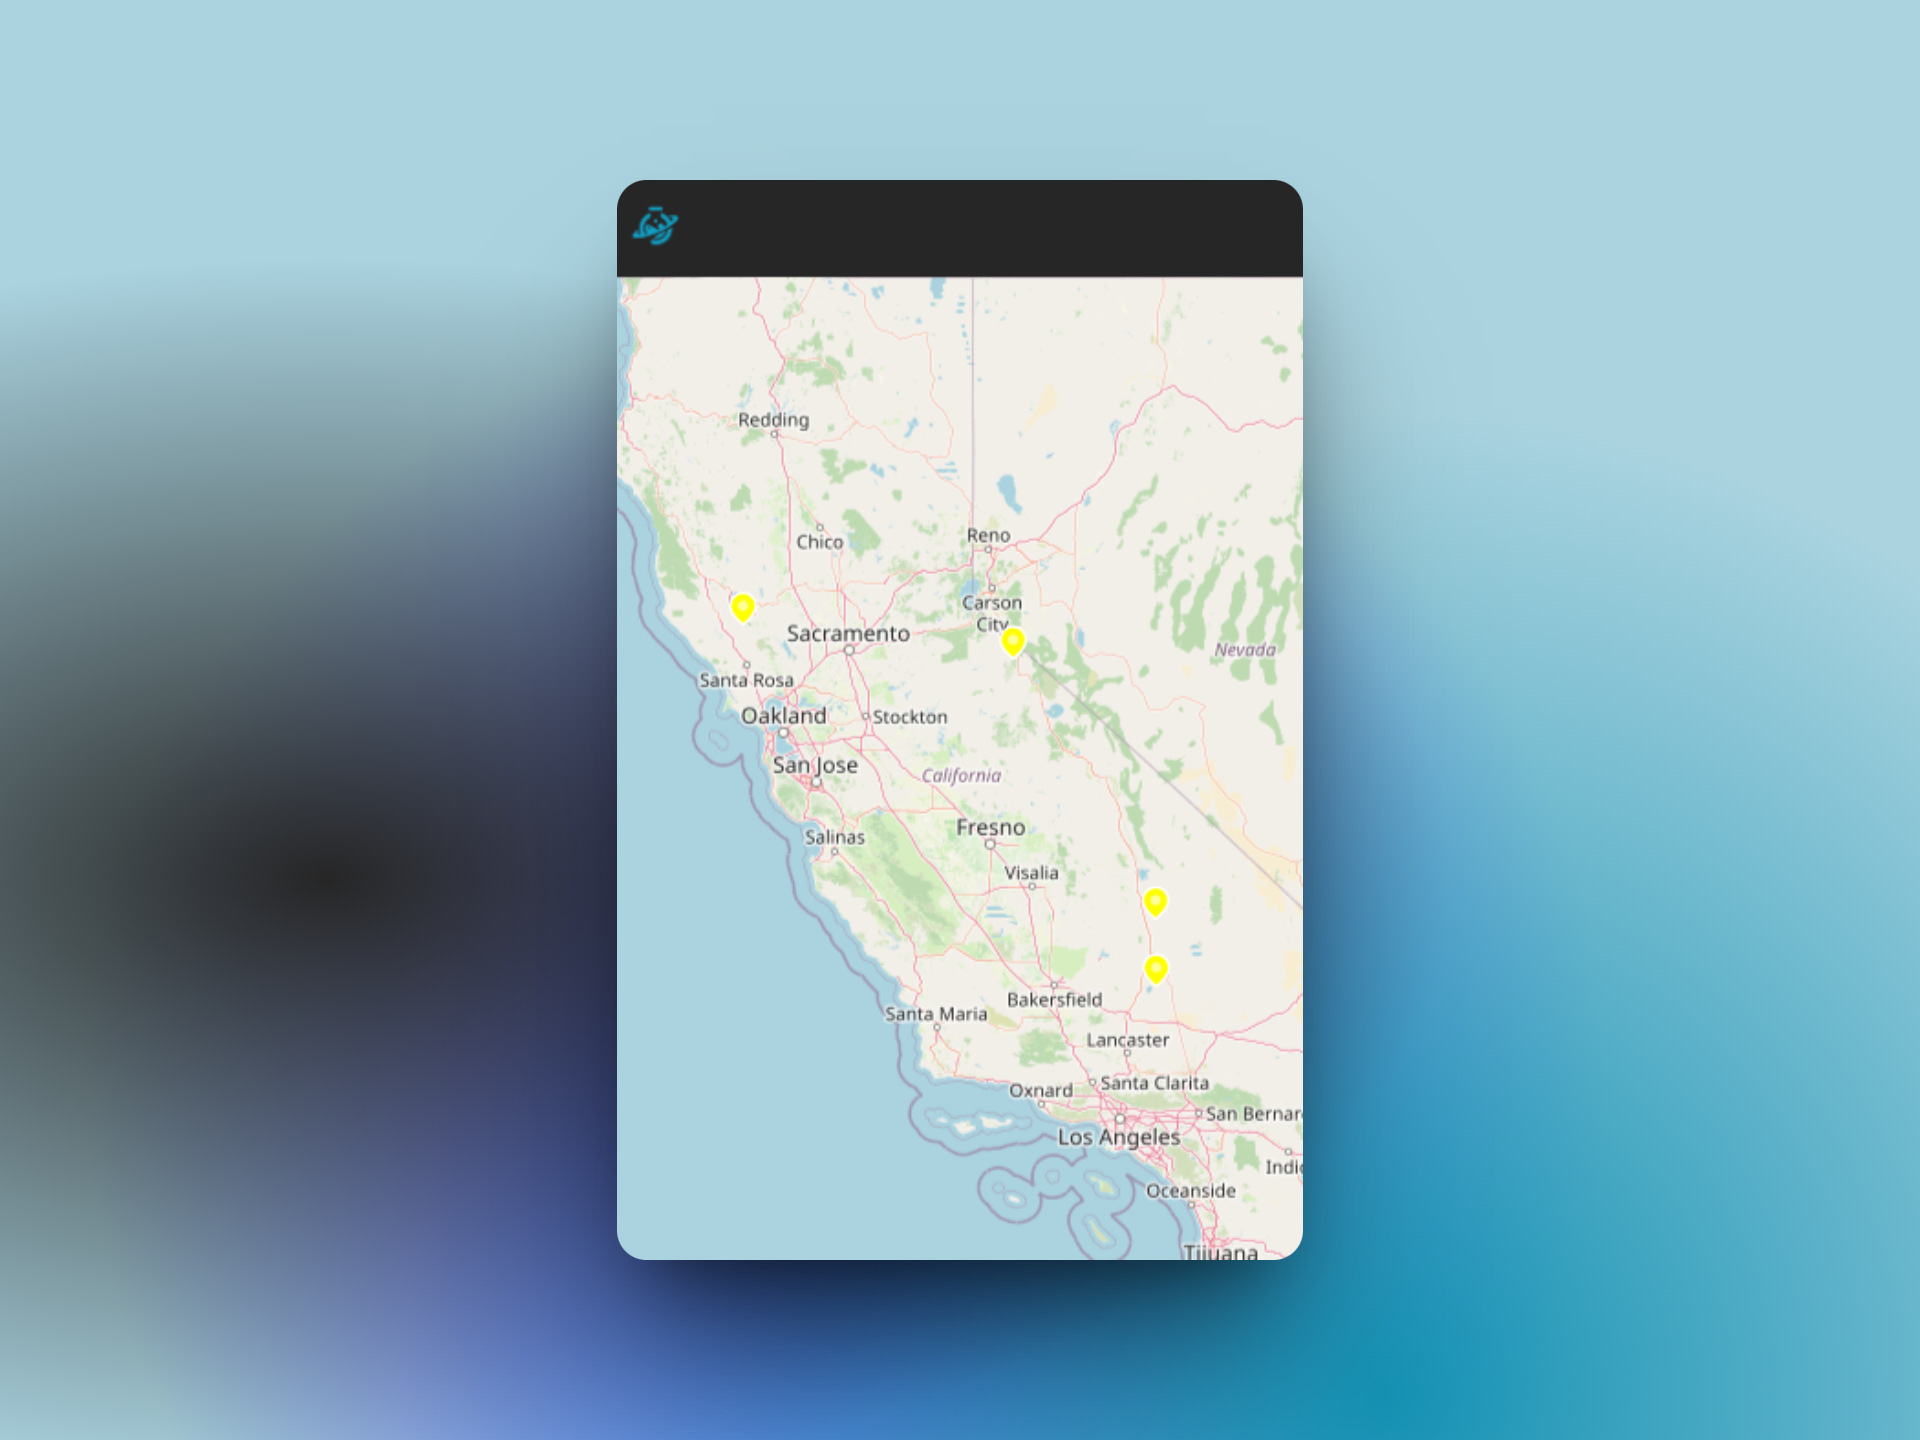
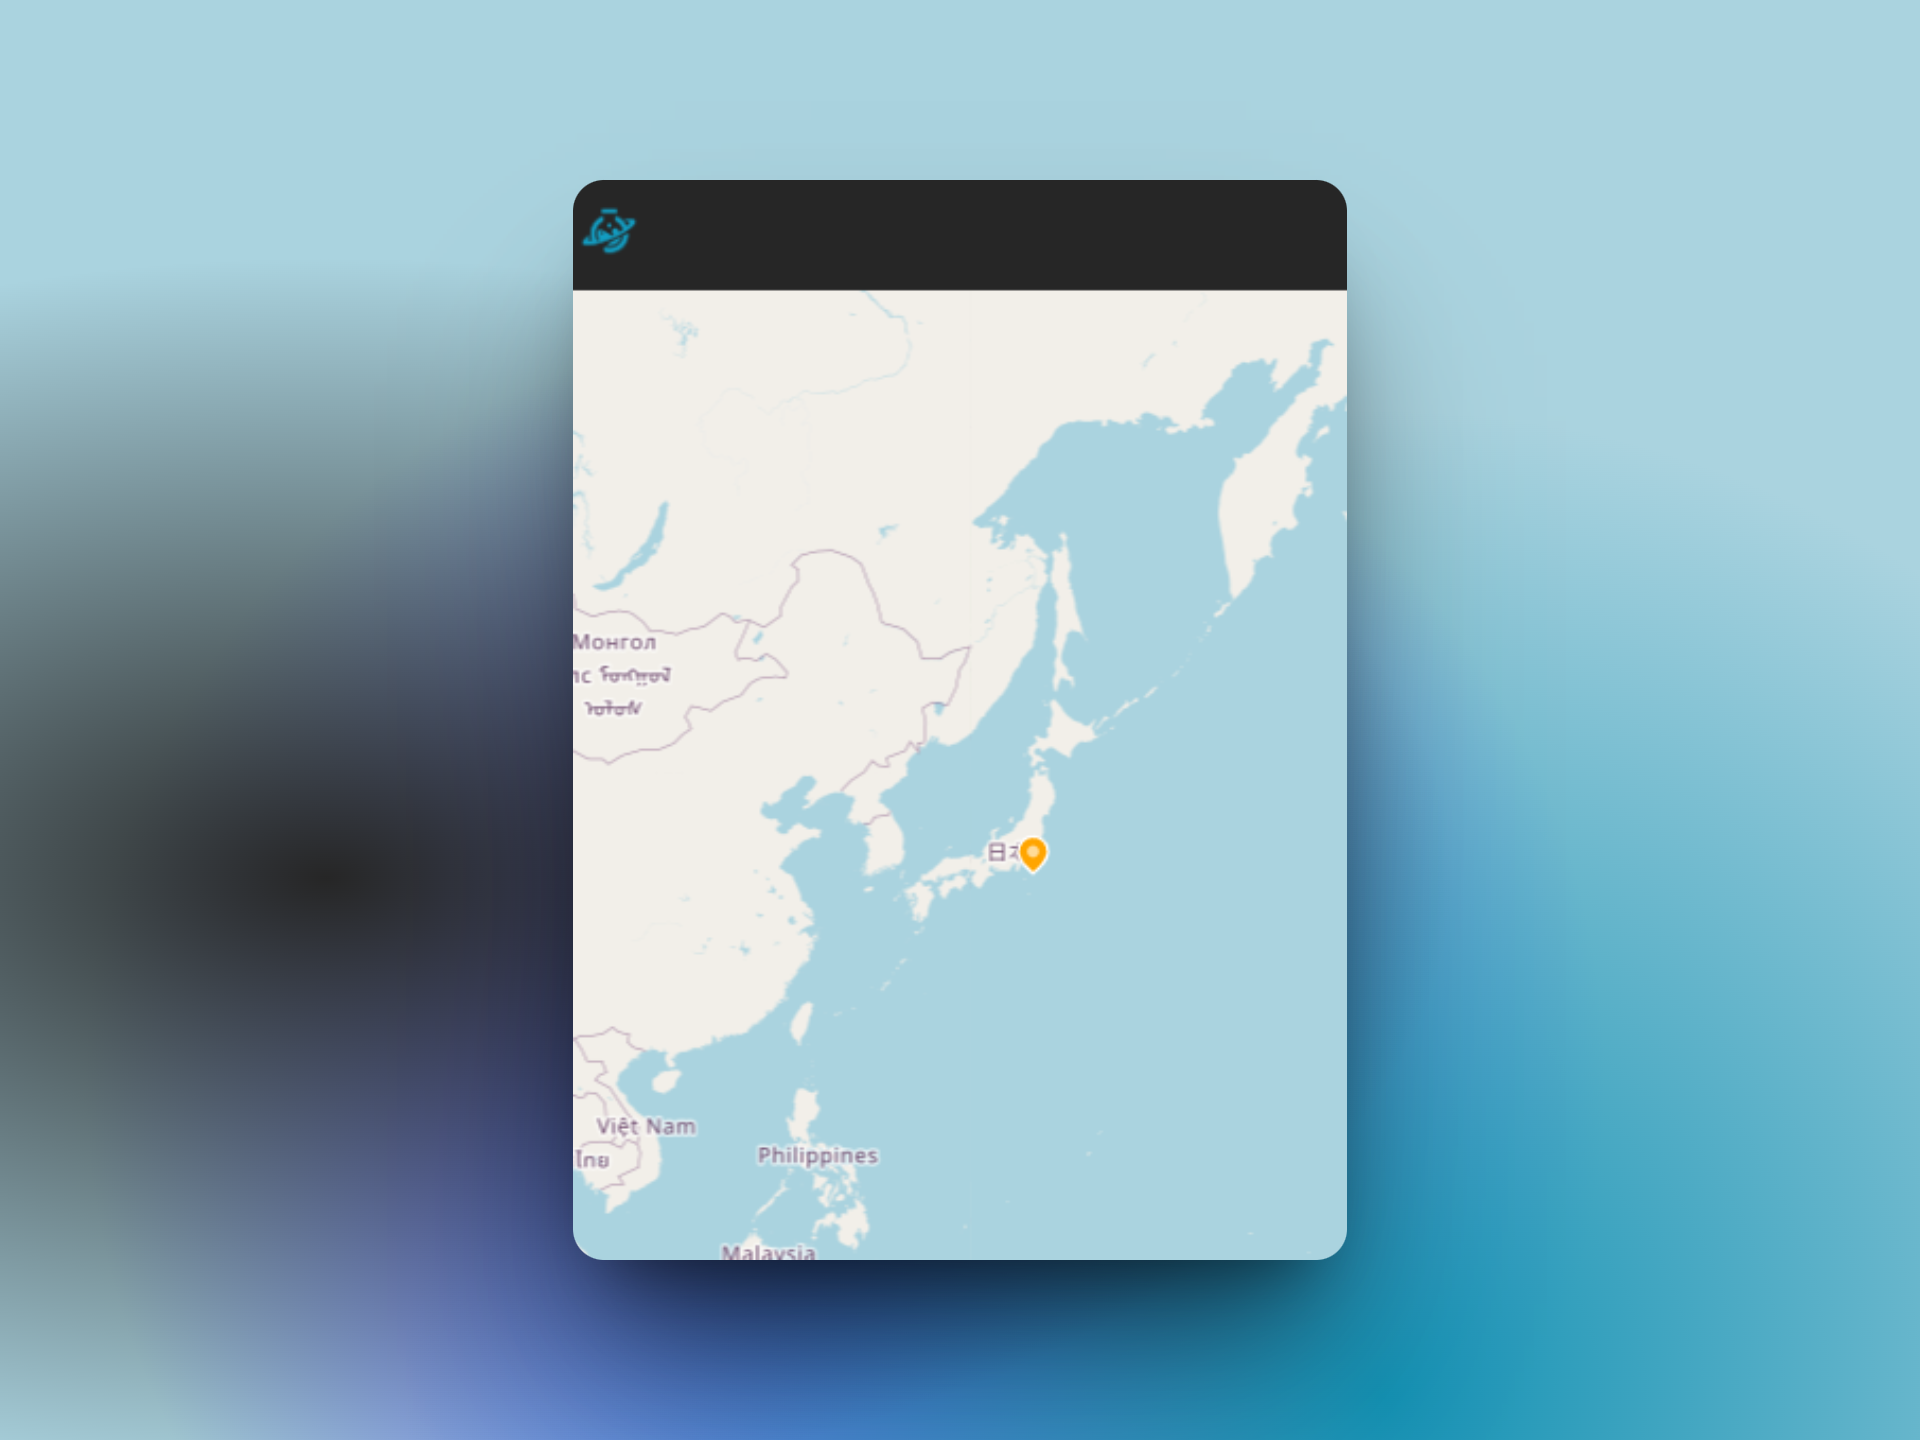
}the result shows the two different magnitudes of earthquakes and how the map icons change based on the real time data pull.
Result and Demo 🎫
While putting together this function, I did see there is a more advanced way of putting together the information based on a range.
Using clamp, it's possible to set a range based on a range and then perform the logic needed to take the exact values and create a color range. This however will have to wait as there are other features I want to add before I get to color ramping.
function clamp(value, min, max) {
  return Math.min(Math.max(value, min), max);
}

//example from google
See the live demo here:


